Blog
Mainstreet 2021: Waynesboro Visualizations
Tags: waynesboro, mainstreet21, visualization
This is a small update on the RCN Mainstreet21 seed fund for Waynesboro, Virginia.
Waynesboro, with its unique situation as a former industrial city and now turning to tourism, has provided the base setting for our testing of various information visualization approaches. These visualizations are geared towards supporting local landscape and urban planning strategic development. Our primary dataset was geo-Social Media from Twitter, Flickr and Instagram.
While society in general benefits from these statistics, there is also a need to protect individual people’s privacy in collected datasets. We have payed particular attention to this detail and published a general open source approach to privacy-aware data handling, based on a statistical data abstraction with HyperLogLog (developers, have a look at lbsn.vgiscience.org).
Dunkel, A., Löchner, M., & Burghardt, D. (2020). Privacy-aware visualization of volunteered geographic information (VGI) to analyze spatial activity: A benchmark implementation. ISPRS International Journal of Geo-Information, 9(10). DOI
Visualizations
First, we explored ‘frequentation surfaces’ (visualizations akin to heatmaps) for two topics discussed online.
The first one attempts to show the prominence of nature related topics.
- Nature-related topics
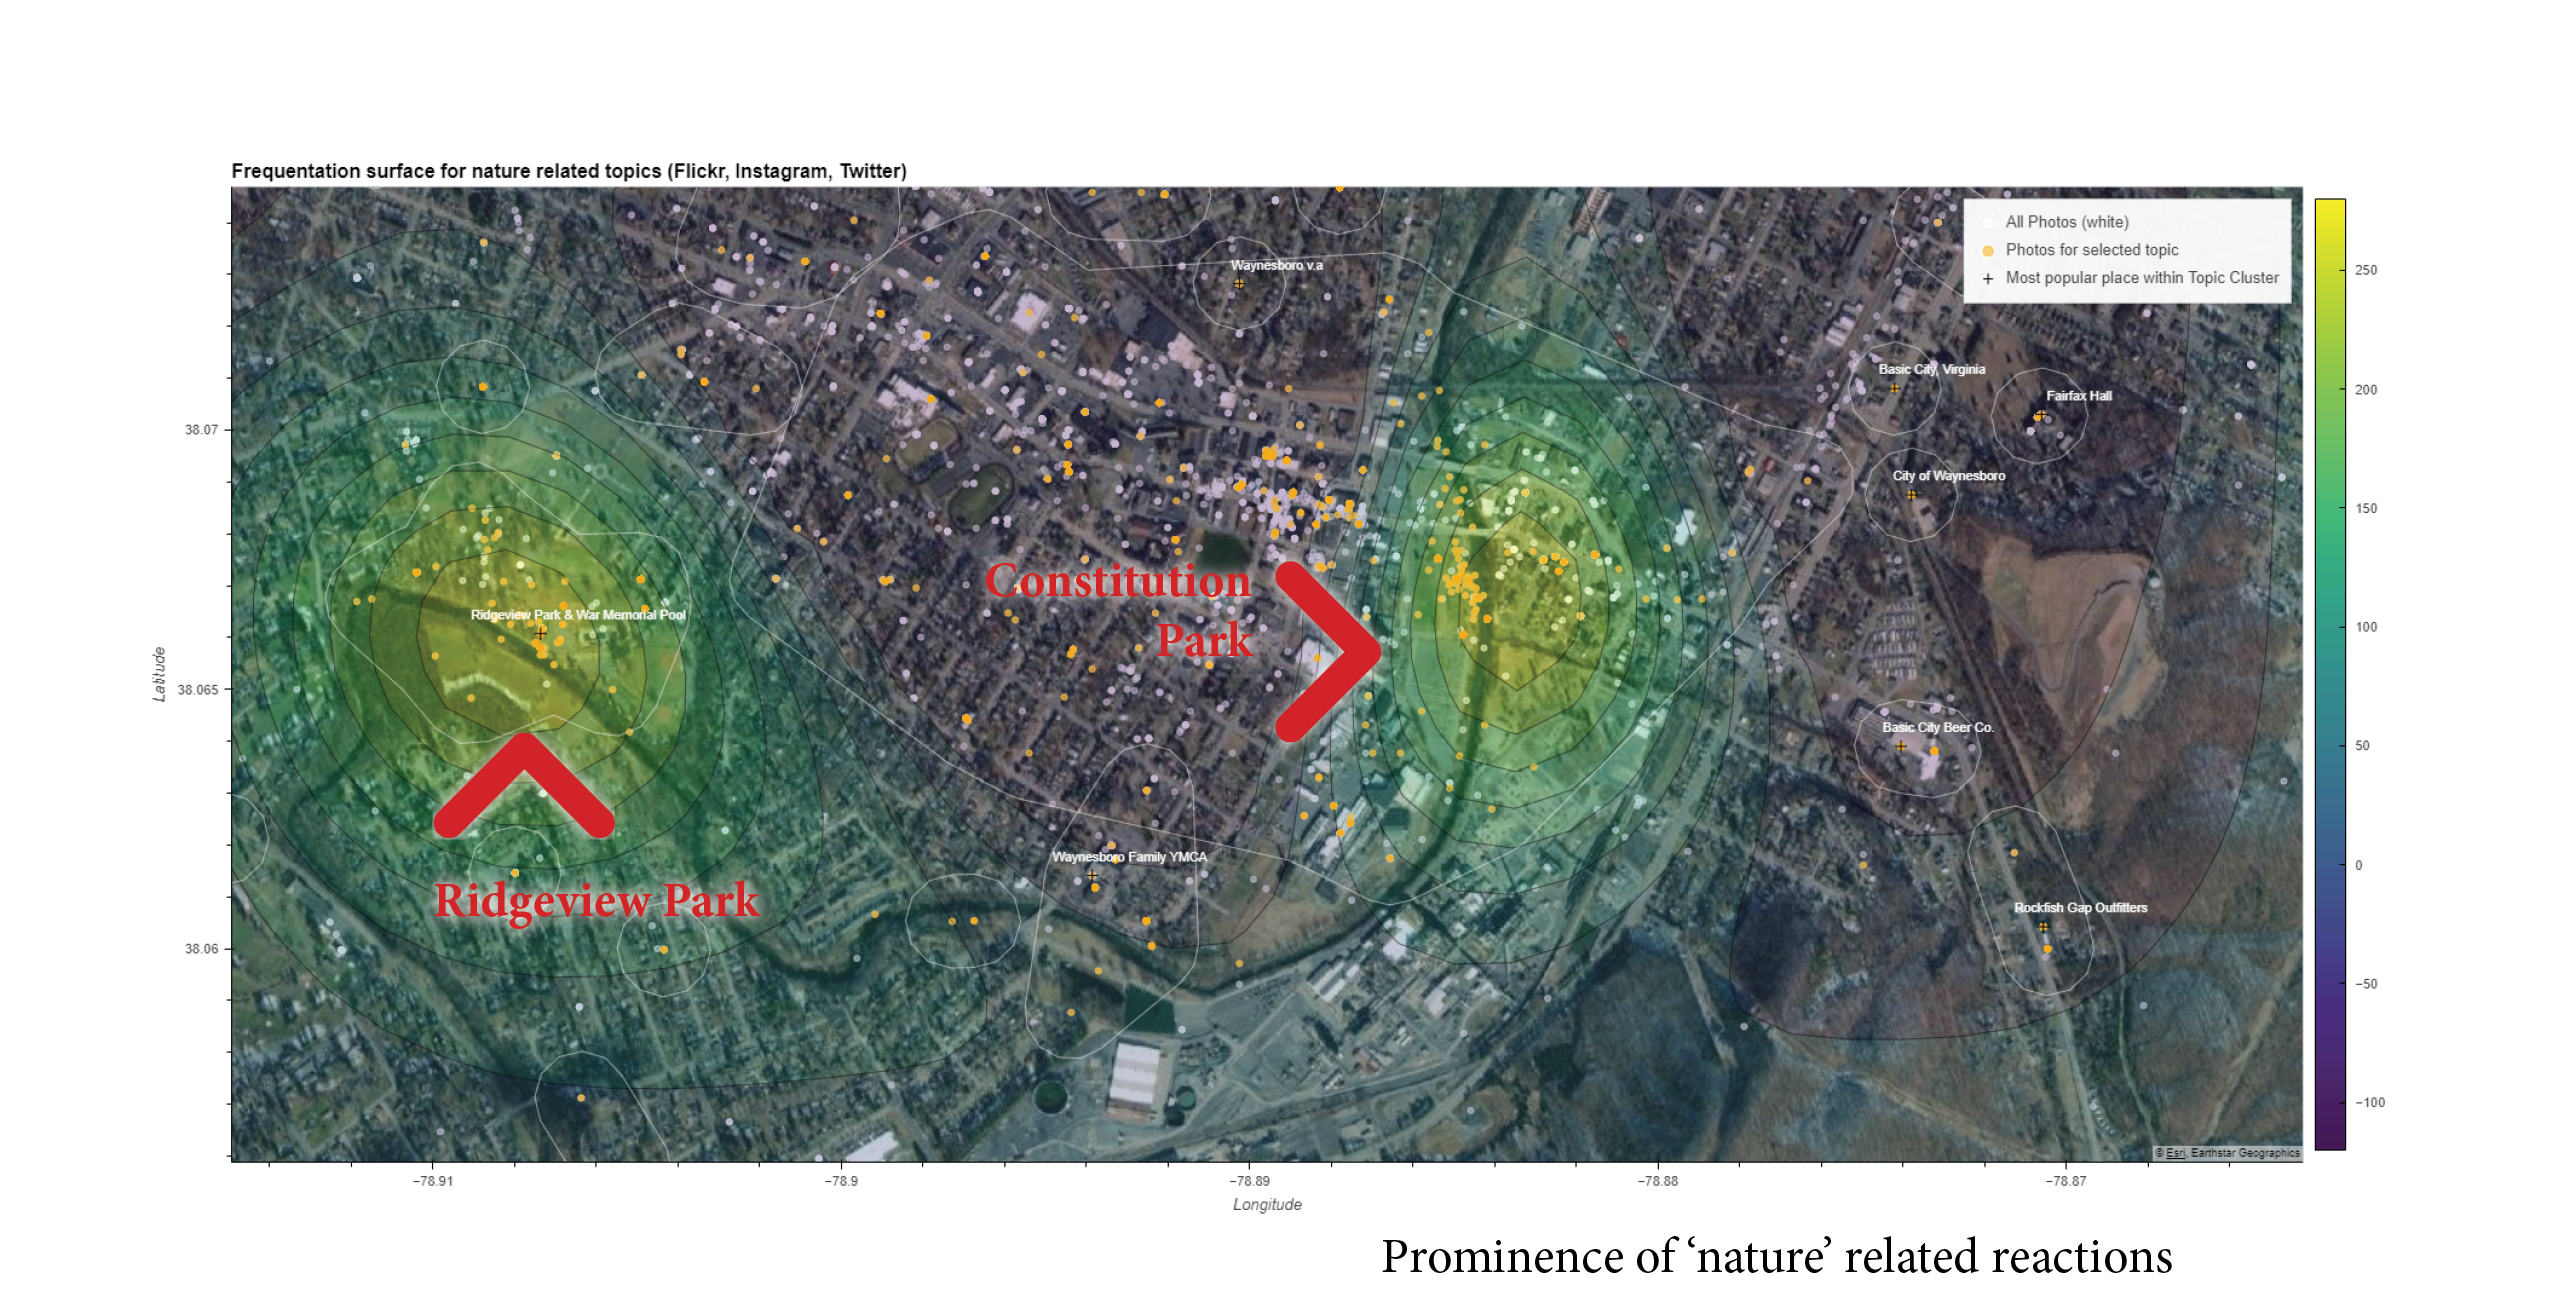
There are two main hot spots for nature related reactions in Waynesboro. The first one is Ridgeview Park, a public green area along the South River, hosting a playground, places for picnic and a swimming pool.
The second area where nature related discussions peak is Constitution Park, east of the city center. This is the main area for public outdoor events and the farmers market.
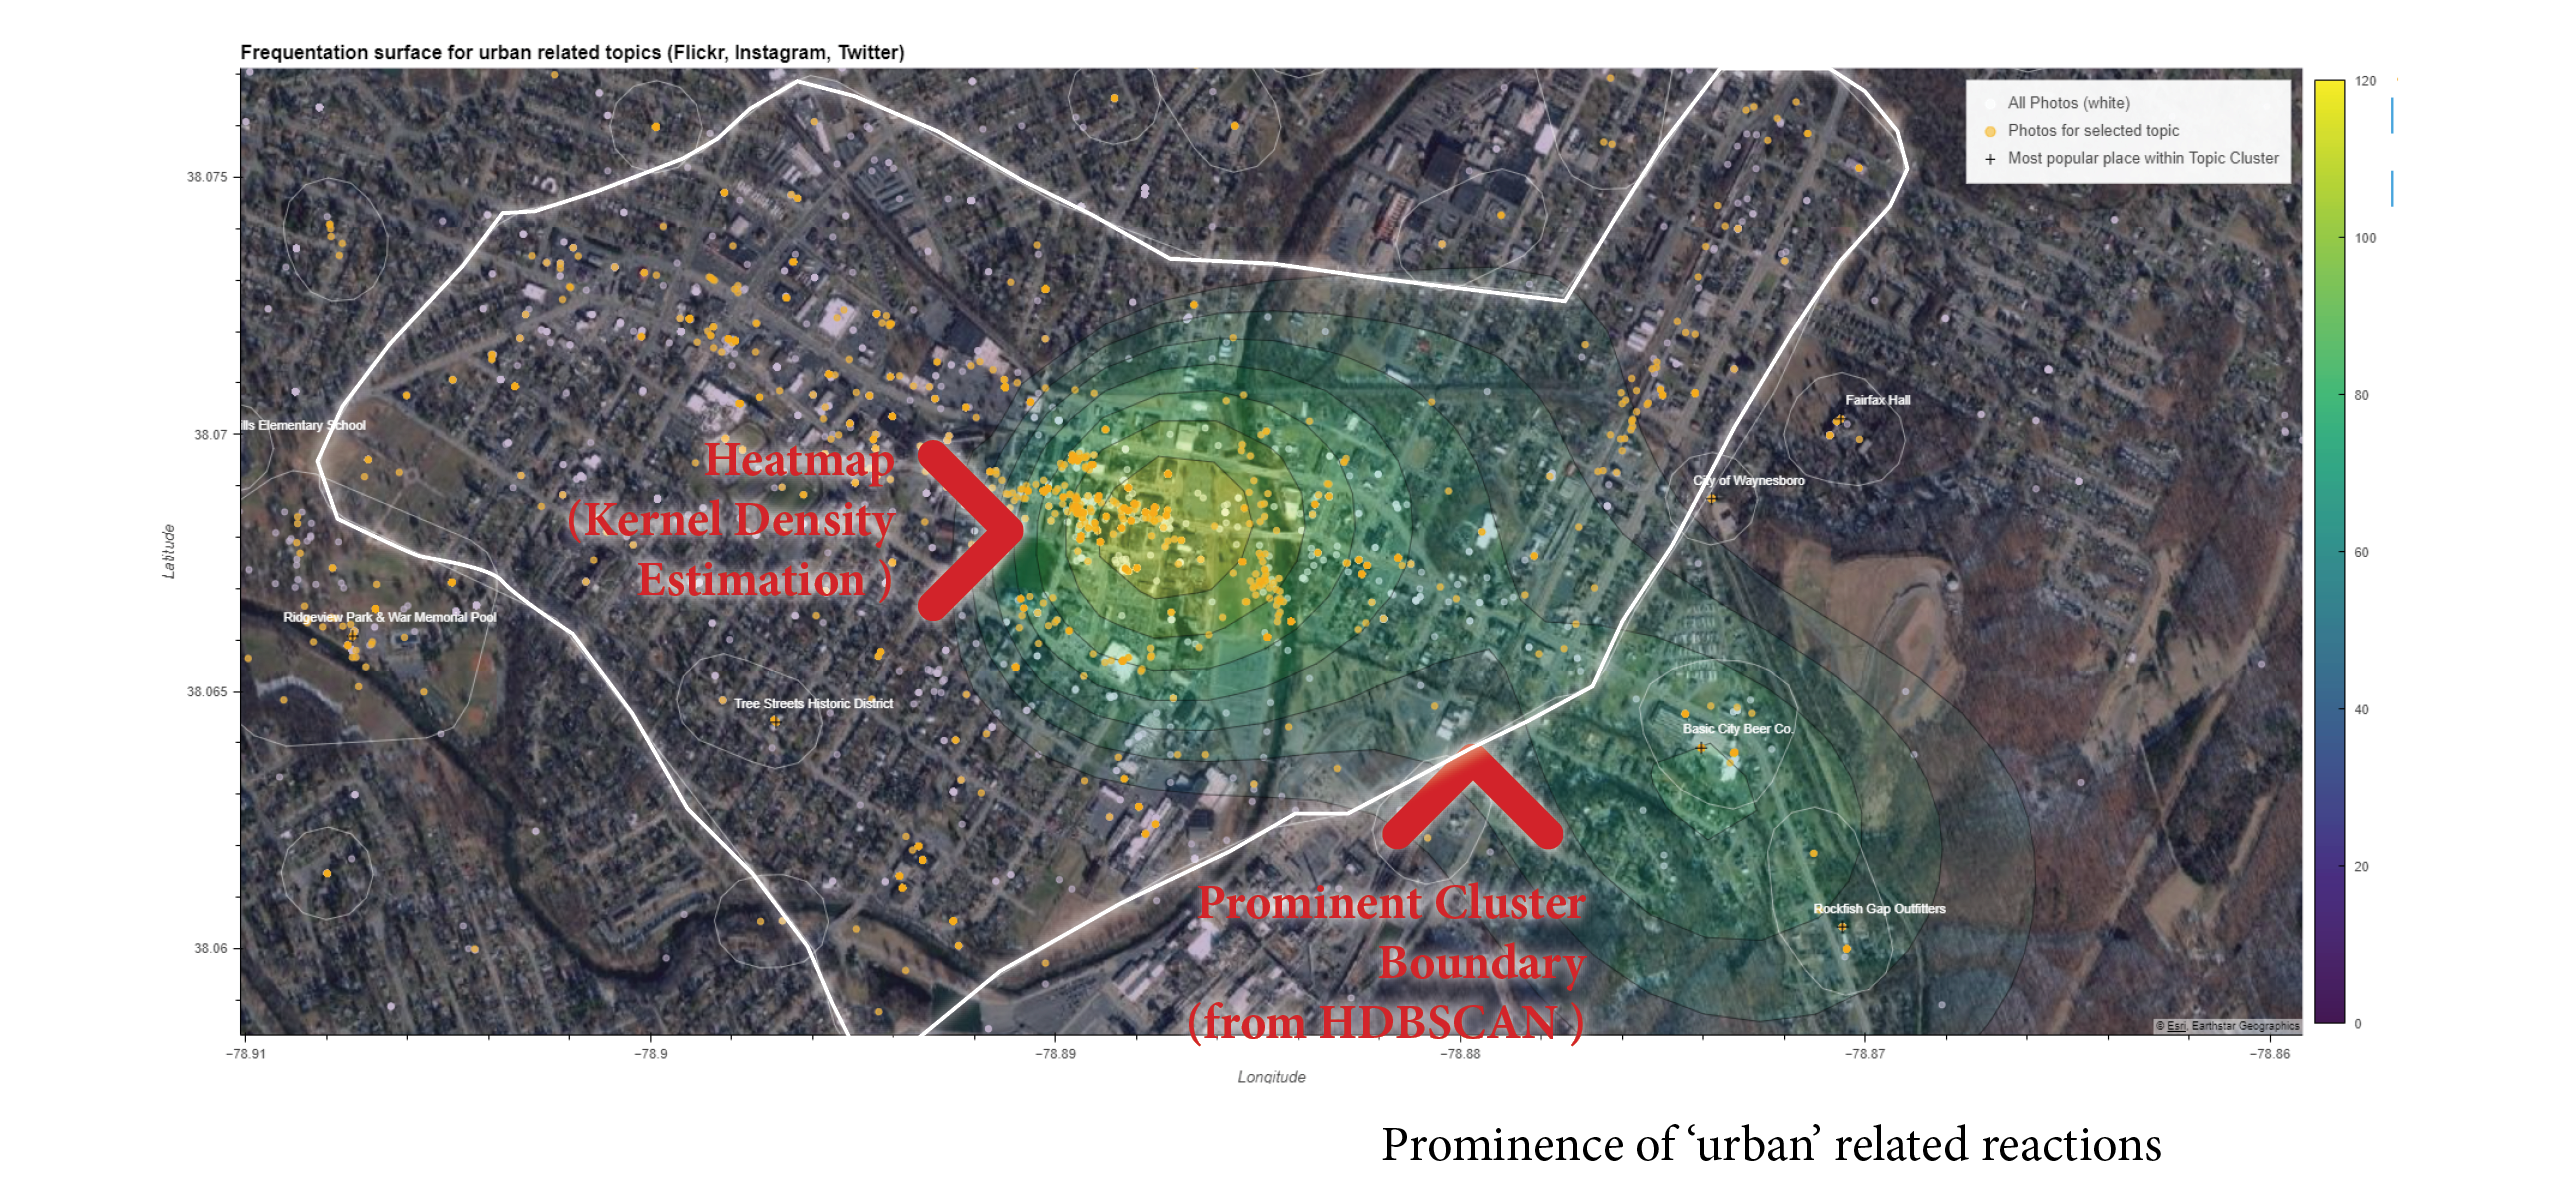
- Urban-related topics
A different heatmap for urban-related reactions is shown below, highlighting the main entrance to the city via U.S. Route 250, passing by the popular Basic City Brewing. Obviously, the urban heatmap peaks at the city centre.
These visualizations are parametric, meaning that maps can be generated for any area or region, allowing seamless transfer to other cities and neighborhoods, or different topics. It may be one of a large number of supplementary datasets that can be considered when thinking, sketching and implementing urban planning strategies.
In the background, the algorithm first creates a “surface” (a heat map) for all available social media posts and one for the selected topic (based on a set of terms), and afterwards normalizes the topic surface based on overall density.
In addition, HDBSCAN Clustering is used to polygon create outlines for particular hotspots. For each hotspot, labels are placed for the single most popular Instagram Twitter or Flickr place (based on post count).
Note that there’s only limited data available for Waynesboro (90,969 posts, with a
majority of Instagram pictures), so the results contain noise.
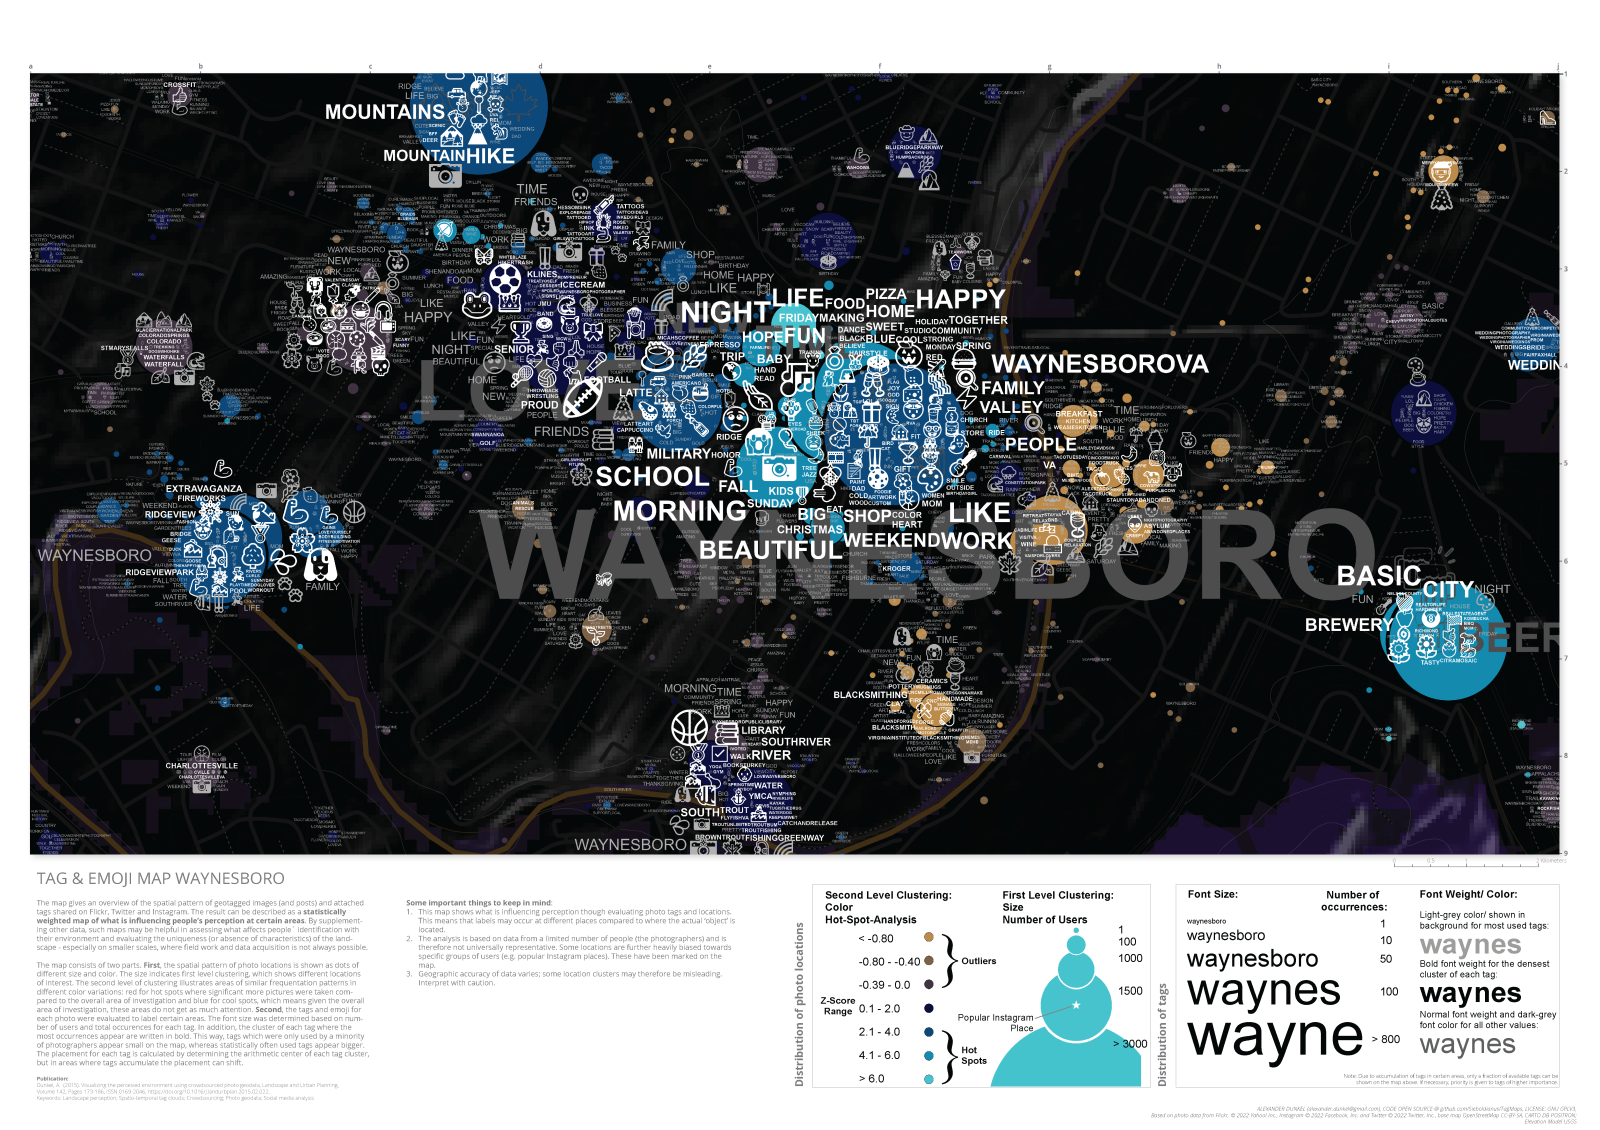
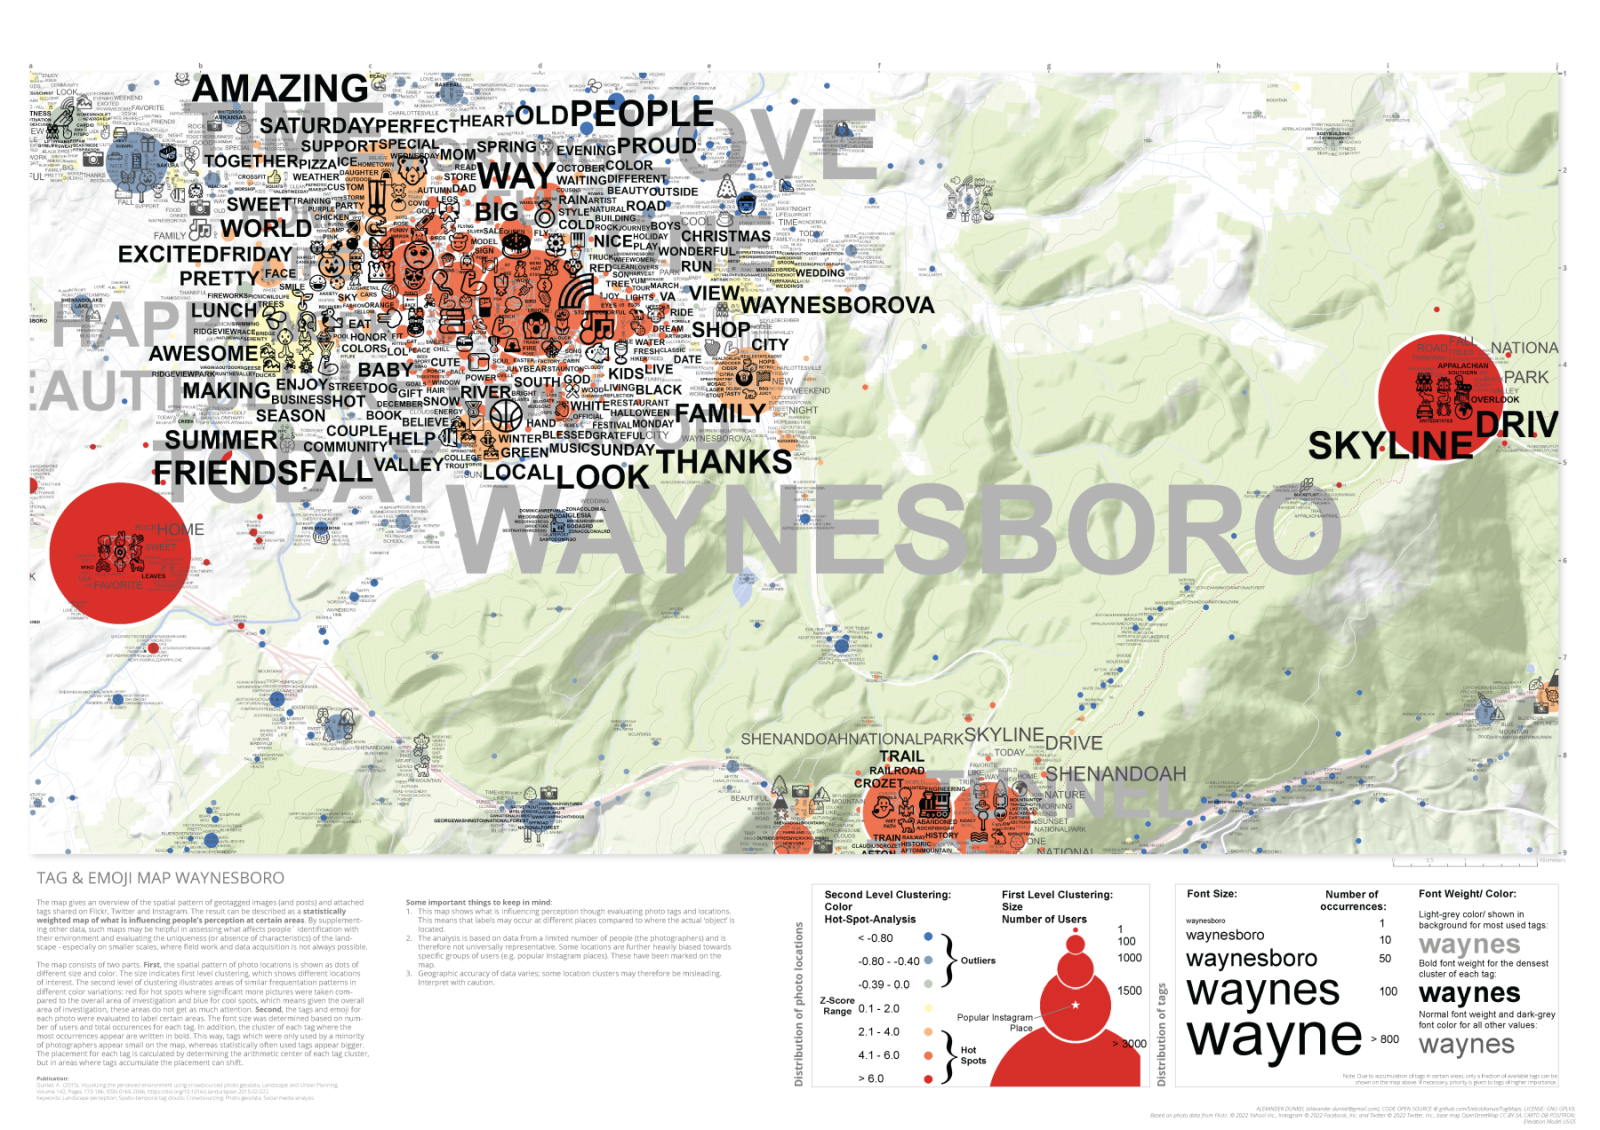
Tag Maps
Another approach provides exploratory visualizations for popular terms used in certain locations. These maps may be used to better understand characteristic perceptions of certain places and how identity emerges from people’s interaction with the environment (e.g. through photographs).
The different color themes below are mere visual styles, the content itself is calculated through a python package, which is made publicly available as open source.
Waynesboro close (dark theme):
Waynesboro close:
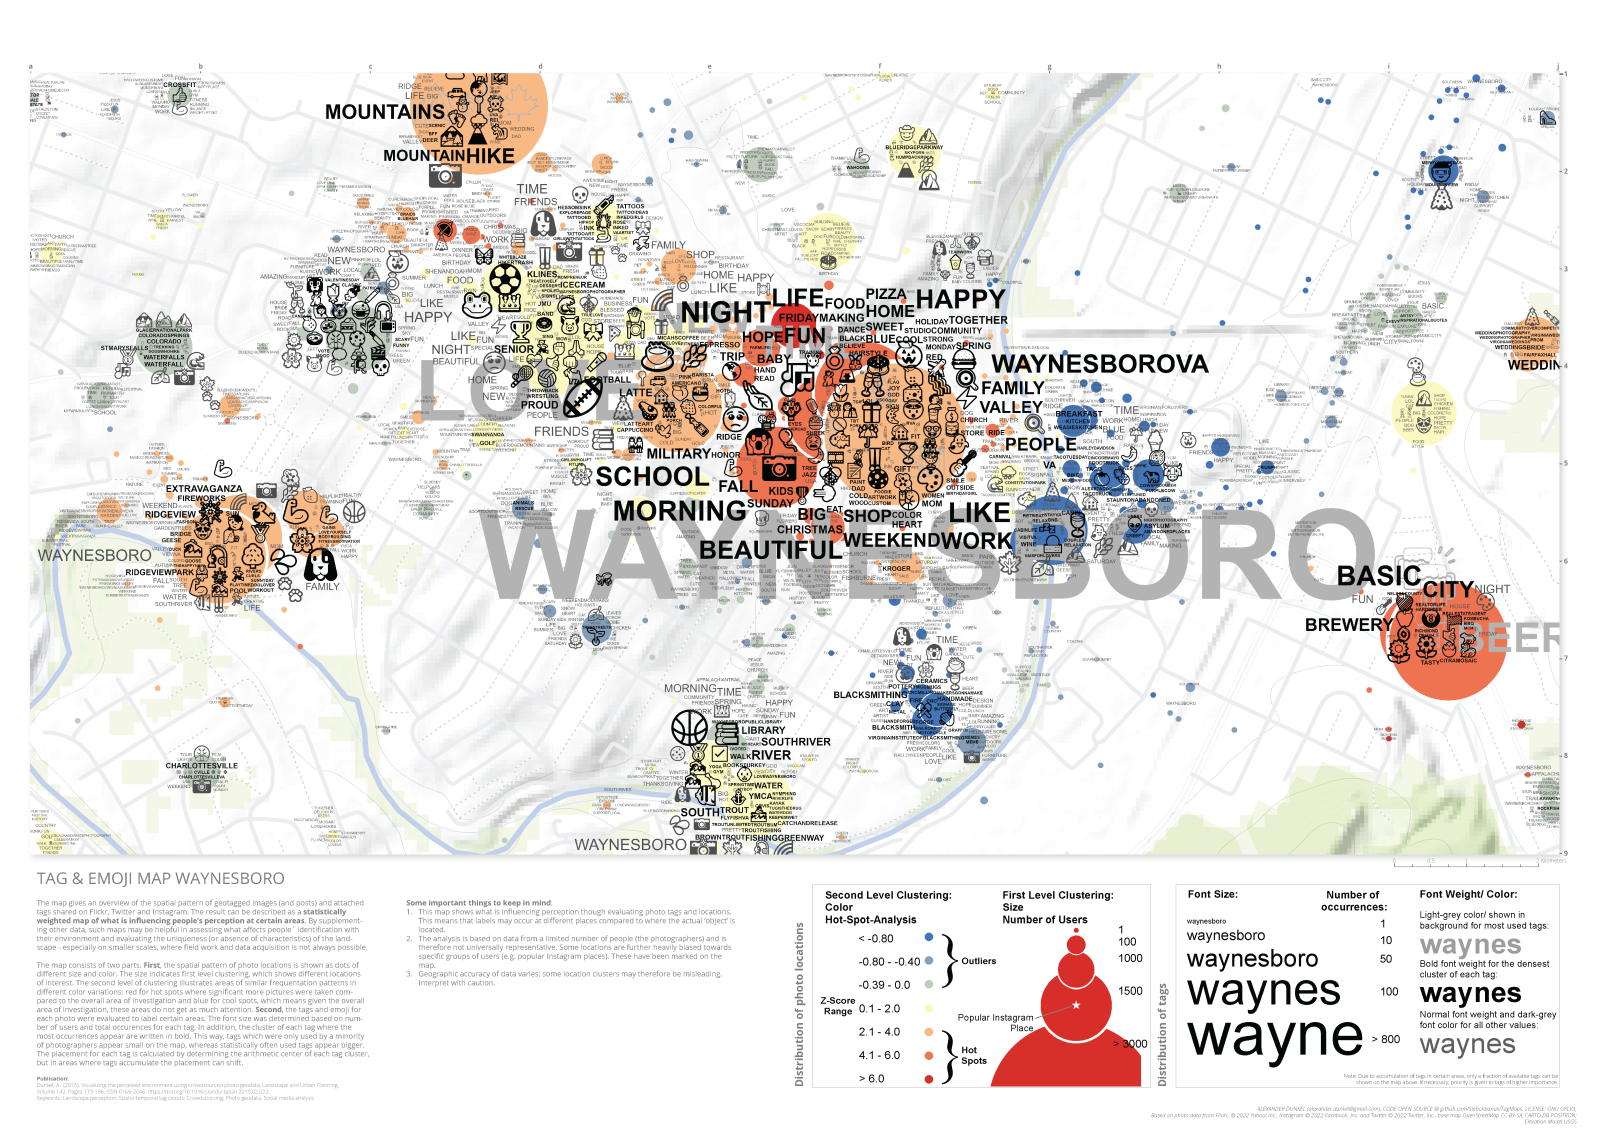
Waynesboro Overview:
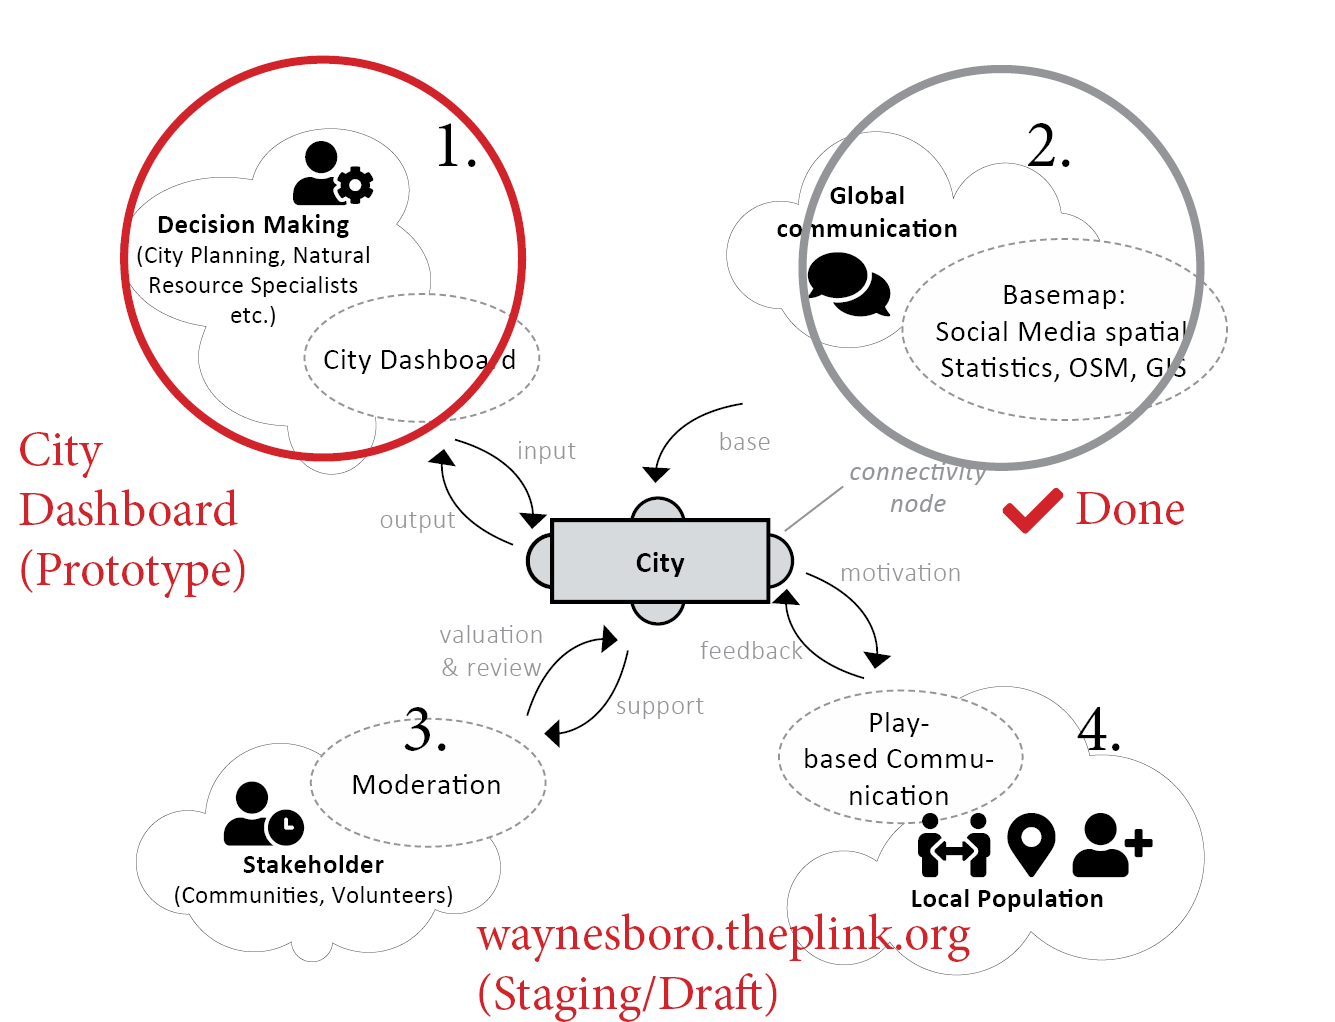
Dashboard
These prototypical visualizations provide little benefit when they are not easily available to planners or not designed interactively. Making these tools easily available is therefore a core goal.
Dominik Weckmüller (MSc) has created a HLL Dashboard prototype for Waynesboro, which can be viewed interactively here: https://geo.rocks/dashboards/waynesboro/
We hope to develop these tools further, into a combined interface that can be used by cities, local planners and the local population to communicate and find the common ground between many opinions. Cities such as Waynesboro are therefore important to explore these directions at a very early stage.
Data Flow
The data that we used is publicly available on Instagram, Flickr, and Twitter, and was retrieved through the public Application Programming Interfaces (APIs). Data was not stored in RAW format. Rather immediate transformation to the privacy-aware data abstraction format guarantees that only quantitative visualizations and approximate summaries are possible, preventing unnecessary collection and retention of data on our side. While not a requirement here, this is backed by the restrictive European’s General Data Protection Regulation (GDPR).
This is an overview scheme for the data flow, processing, and integration:
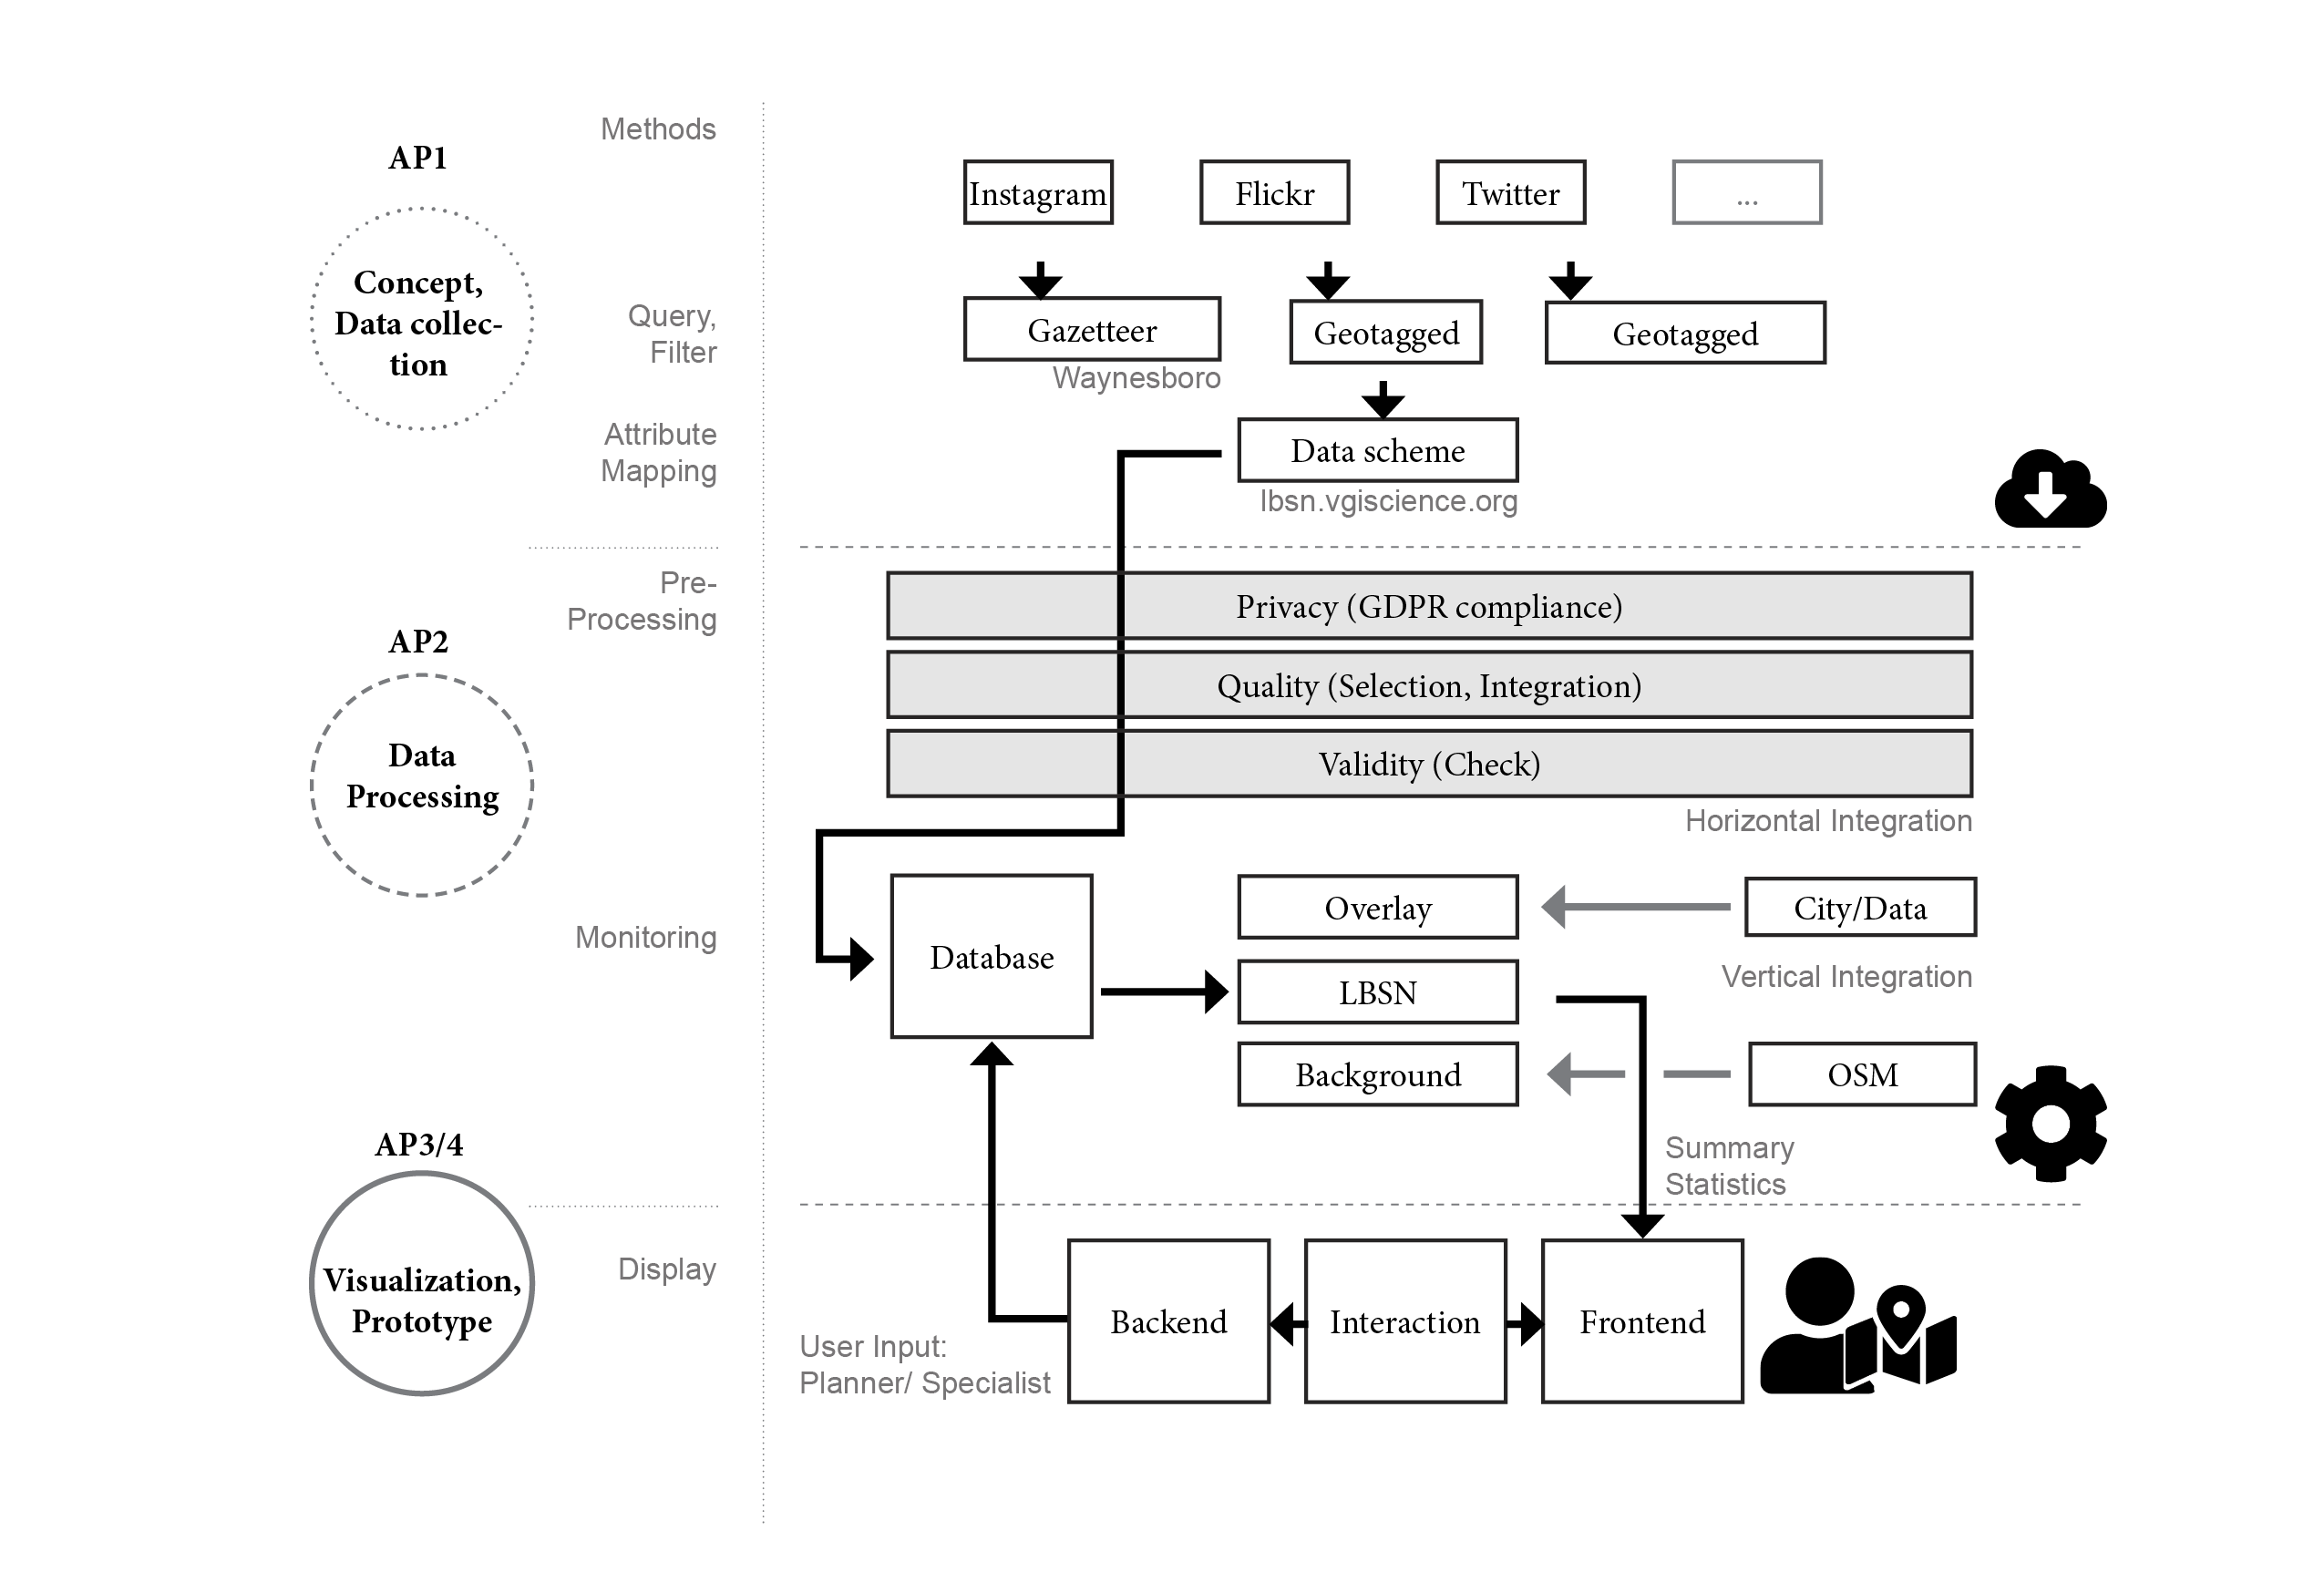
Together with the dashboard, we are making progress in supporting cities regarding
four sources of VGI data:
All of these approaches have been cross-financed through different grants, including the seed-fund for Waynesboro. We are making heavy use of Open Source tools and we aim to publish all of our tools as Open Source Software itself. See a list of linked tools that are available so far here. The integration of these tools is one of our primary future goals.